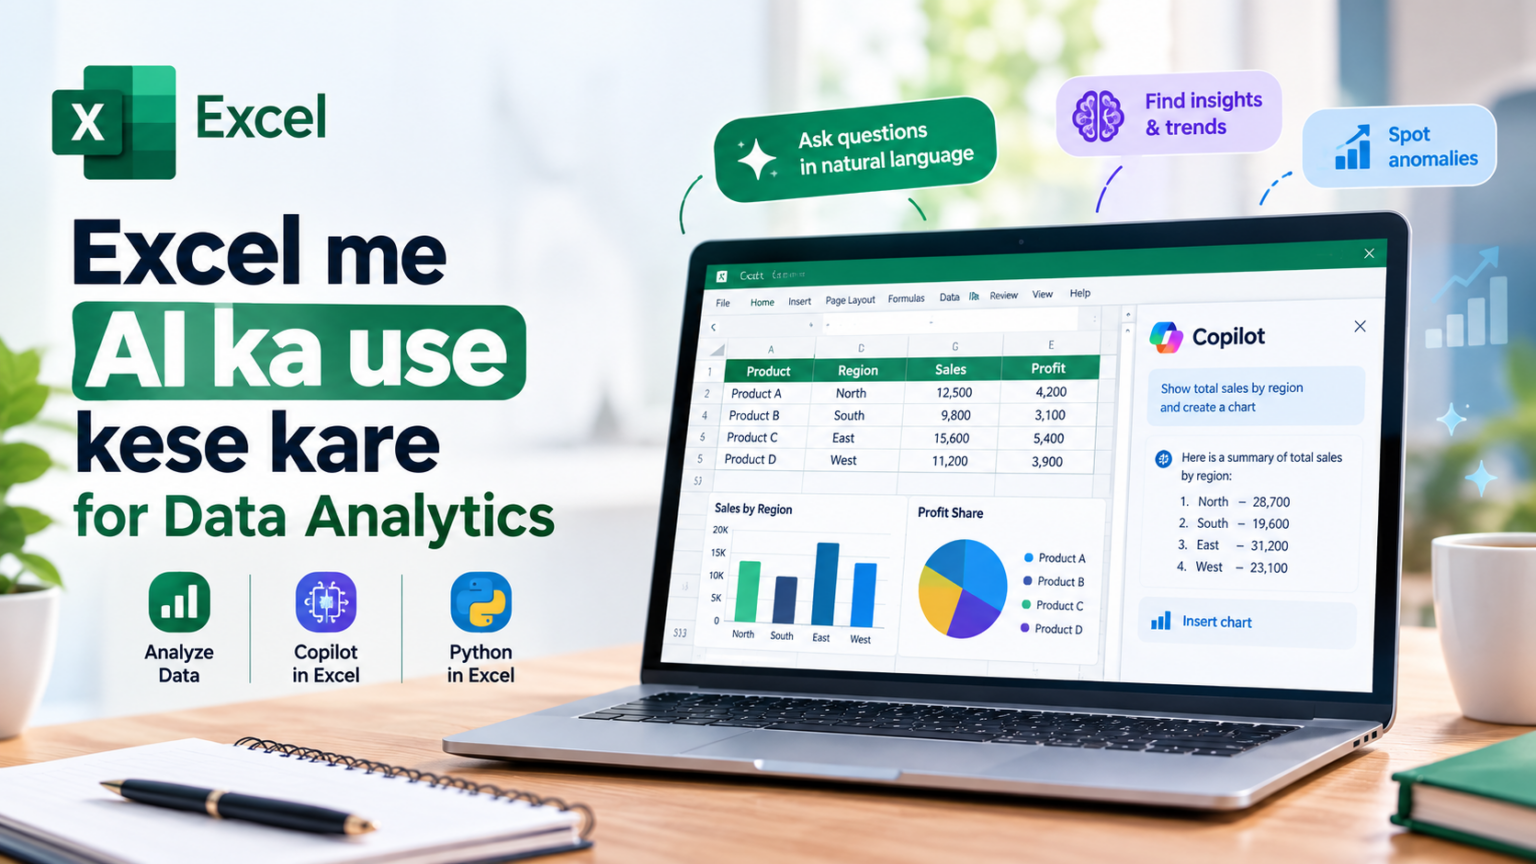
Excel business ke data ko sahi se arrange krne, report banane, metrics ka calculation krne or pradarshan ko sahi se track karne ke lie sabse jyada use kie jane wale tools me se ek hai.Lekin badi spreadsheet ko manual roop se jaanch krna kafi samay le sakta hai, khaskar tab jab business ko trend pehchane, result ki tulna karna, asamanya value ko find karna or raw data ko kisi useful information me badalne ki need hoti hai.
Excel me AI Powered feature ki madad se aap inmese kai kaam ko kathin formula ya manual calculation par puri tarah depend rehne k bajaye aap saral bhasha me sawal puchh kar jankari prapt kar sakte hai. Microsoft excel me ab data analyze aur copilot in excel jese tools uplabdh hai, jabki python in excel more advanced data analysis k process me kaam aa sakta hai.
Data Analysis ke lie excel me ai ka upyog kese kare, data analysis sikhne se professionals kafi achi tarike se kaam kar sakte hai or sath hi spreadsheet manage karne ke lie apne purane excel environment ko jari rakh sakte hai. Khaas baat yah samjhna hai ki ai kya kar sakta hai, apne data ko kaise ready krna hai aur business se jude faisle lene se pehle results ko kese verify krna hai.
Excel me Data Analysis ke lie AI ka kya matlab hai?
Excel me AI ek ese feature ko kaha jata hai jo saral language me die gaye commands, automated insights, formula generation, pattern detection aur dusre intelligent capabilities ke medium se user ko spreadsheet data ka analysis karne me help kar sakta hai.
Har column ko manually dekhne k bajae, users apne data ke bare me sawal puchh sakte hai aur summaries, comparisons, visualizations ya suggested calculation prapt kar sakte hai. For example, microsoft ka analyze data feature user ko kisi data range ke bare me sawal puchhne aur charts, table, pivot tables jese result hasil karne ki suvidha deta hai.
Business ke liye yah un workers ke lie routine data analysis ko aasan bana sakta hai jinhe advanced excel ya data science skills ki koi jankari nhi hai. For example, ek sales manager sawal puchh sakta hai ki kis region ne sabse jyada revenue generate kia, jabki operation team unusual inventory values ki jaanch kar sakti hai.
Lekin AI ko automatic source of truth ke bajae ek analytical assistant ke roop me dekhna chahiye. Results ko hamesha original spreadsheet aur business ke sath review karna chahiye.
AI ka use karne se pehle Excel Data kaise ready kare
AI dwara ready kie gaye analysis ki quality kafi had tak spreadsheet ki quality aur structure par depend karti hai. AI ka use karne se pehle data ko meaningful column heading vali ek clear table me arrange kare.
Jinki need na ho un blank rows, inconsistent labels, duplicate records aur mixed data types se bachein.For example, ek sales dataset me Date, Product, Region, Quantity, Revenue, Cost aur Profit jaise columns ho sakte hai.
Data preparation khas roop se important hai kyuki AI tools ko yah samajhne hota hai ki har column kya represent karta hai. Microsoft Excel me copilot ka use karte samaye specific questions puchhne aur related columns ka naam batane ki salah deta hai, kyuki jyada precise prompts better results de sakte hai.
Ek practical preparation checklist me shamil hai:
- Missing values ko investigate karna
- duplicate records jo jaruri na ho unhe hatana
- Dates ko standardize karna
- Confirm karna ki numbers actual me numbers ke roop me stored hai
- Descriptive aur clear column names rakhna
Agar spreadsheet me customer information, financial records ya dusre sensitive business data shamil hai, to AI-powered features ka use krne se pehle organizations ko apni data governance aur privacy requirements par bhi sochna chahiye.
Excel me Analyze Data ka use kaise kare
Excel me AI-assisted analysis ka sabse easy tarika Analyze Data feature ka use karna hai.
Ek suitable data range select karne ke baad, user Home tab se Analyze Data khol sakte hai aur data ke bare me sawal puchh sakta hai. Yeh feature visual summaries pradan kar sakta hai aur dataset me patterns, trends ya dusre interesting aspects ko pehchanne me help kar sakta hai.
For example, maan lijiye kisi online retailer ki spreadsheet me product aur region ke according monthly sales di gayi hai. kai PivotTables manually banane ke bajae, user is tarah ke sawal puchh sakte hai.
- “kis region ne sabse jyada sales generate kari?”
- “Product A ki monthly sales trend dikhaein।”
Data aur available excel features ke aadhar par results me tables, charts ya PivotTables shamil ho sakte hai.
Yah tarika khas roop se initial exploration stage me useful hai, jab purpose deeper analysis shuru karne se pehle yah samajhna ho ki dataset me kya information mojood hai.
Data Analysis ke lie Excel me Copilot ka use kese kare
ChatGPT, Gemini aur Claude jaise AI tools ki tarah, Copilot in Excel bhi natural language ka use karke spreadsheet data ke sath interact karne ka tarika pradan karta hai.
User trends, comparisons, outliers, summaries aur calculations se jude sawal puchh sakte hai, bina har formula ko manually banane ki need ke .
Microsoft ke according, Copilot ka use highest aur lowest sales wale regions pehchanne, anomalies find karne, formula columns generate karne aur lookup formulas banane jese kaamo ke lie kia ja sakta hai.
Ek useful workflow yeh hai ki shuruwat ek broad question se kare aur fir jyada specific questions puchhe.
For example, aap puchh sakte hai:
“ Is sales data me khaas trends kya hai?”
Iske baad puchh sakte hai:
“Is increase me kin products ka sabse bada yogdan raha?”
Ya:
“Pehli aur duri quarter ke revenue ki comparison kare”
Microsoft specific questions ka use karne ki bhi salah deta hai, kyuki clearly defined requests Copilot ko intended analysis samajhne me help karti hai.
Excel Formulas ko Generate aur samajhne ke lie AI ka use
Jab workbook me complex calculations hota hai, to Excel formulas ko likhna aur maintain karna difficult ho sakta hai. AI formulas suggest karne aur existing formulas ko samajhne me help kar sakta hai.
For example, user profit margin, percentage growth, do values ke bich difference ya kisi dusri worksheet se lookup karne ke lie formula maang sakta hai.
Copilot workbook मे me mojood kisi existing formula ko bhi explain kar sakta hai. Ye un workers ke lie useful ho sakta hai jinhe kisi dusre vyakti dwara banai gayi spreadsheet par kaam karna padta hai.
lekin, generated formula ko bina jaanch accept nahi karna chahiye. Formula syntactically correct ho sakta hai, lekin fir bhi specific business logic ke lie unsuitable ho sakta hai.
Generated formulas ko known values ke sath test kare aur confirm karein ki calculation aapki intended definition ke anusar hai.
AI ki help se Trends, Outliers aur Patterns kaise find kare
Excel data analysis me AI ka ek sabse useful application exploratory analysis है।
hazaron rows ko manually review karne ke bajae, user AI se unusual values, trends, groups ke bich differences ya time ke sath hone wale changes pehchanne ke lie kar sakte hai.
For example,, monthly expenses ka analysis karne wali kai company puchh sakti hai ki kis category me sabse adhik increase hua ya kya koi unusual spending pattern dikhai de raha hai.
AI customer feedback aur dusre text-heavy spreadsheet data ko explore karna bhi easy bana sakta hai. Microsoft ke anusar, Copilot comments ko summarize karne, themes aur sentiment pehchanne aur workbook me analysis jodne me help kar sakta hai.
Ye capabilities surveys, customer reviews, support tickets aur internal feedback kelie useful ho sakti hai. Lekin jab interpretation ka asar business ya customers par pad sakta hai, tab underlying data ko manually review karna jaruri nhi.
Python in Excel Advanced AI-Assisted Analysis me kaise help karta hai
Advanced analysis ke lie Excel eligible Microsoft 365 environments me Python ko sidhe support karta hai.
Python in Excel users ko worksheet cells me Python formulas likhne aur data analysis, visualization aur kuch machine-learning workflows ke lie pandas, NumPy, Matplotlib aur scikit-learn jaisi libraries ka use karne ki suvidha deta hai.
Yah spreadsheet-based work aur advanced analytics ke bich ek useful bridge banata hai.
For example, ek business analyst familiar Excel tables ke sath kam jari rakhte hue statistical analysis, data transformation या advanced visualizations ke lie Python ka use kar sakta hai.
Python in Excel kuch specific Microsoft 365 licensing aur availability requirements ke under me hai. Islie organizations ko kisi workflow ke adhar par design karne se pehle yeh verify karna chahiye ki unhe Excel environment me yah feature available hai ya nhi.
Excel Data Analysis ke lie Practical AI Prompts
AI analysis ki quality jyadatar is baat par depend karti hai ki question kitni clarity se likha gaya hai.
sirf “Analyze this data” puchhne ke bajae apne objective, relevant columns, comparison period aur desired output ke bare me jankari de.
For example, sales manager is tarah ka prompt use kar sakta hai:
“Region ke according revenue ka analysis karein aur month-over-month sabse jyada increase wale tin regions ki pehchan kare। Findings ko ek table me summarize karein।”
kuch other useful prompts:
- “Product category ke according average order value calculate karen”
- “Monthly expenses me unusual changes identify kare।”
- “Is quarter ke revenue ki previous quarter se comparison karein”
- “Monthly sales trend dikhane wale chart banaein।”
Advanced analysis ke lie user Copilot se exploratory analysis karne ke lie keh sakte hai ya Python ke sath advanced analysis mode ka use kar sakte hai.
Excel Analysis ke lie AI ka use krte samaye Common Mistakes
Ek common mistake hai poorly structured data ka use karna aur AI se reliable conclusions ki ummed karna.
Agar columns me inconsistent values hai, dates galat format me hai ya important records missing hai, to resulting analysis misleading ho sakta hai.
Ek dusri galti hai business objective batae bina kuch broad questions puchhna, Specific prompts se useful results hasil karna generally easy hota hai.
Ek or important baat hai, AI-generated results ko verify na karna. Microsoft users ko Excel me AI-generated content ko review, edit aur verify krne ki salah deta hai.
AI calculations aur interpretation me help kar sakta hai, lekin users yah investigate karne ke lie responsible rehte hai ki output underlying data ko accurately represent karta hai ya nhi.
Important financial, operational and strategic decisions ke lie AI-generated insights ko final decision ke bajae analysis ki starting point ke roop me dekhna chahiye.
Businesses AI-Powered Data Analysis ko kese Integrate kar sakte hai.
AI-assisted Excel analysis tab jyada valuable ho jata hai jab ise broader business data workflow se joda jata hai
Har spreadsheet ko ek alag document manne ke bajae, organizations data collection, cleaning, analysis aur reporting ke lie consistent processes sthapit kar sakti hai.
Isse repetitive work kam ho sakta hai aur alag alag departments me reporting jyada consistent ho sakti hai.
Jin businesses ko jyada advanced solutions ki need hoti hai, ve custom software, automation, dashboards, data integrations aur apne specific workflows ke according designed AI solutions par bhi vichar kar sakte hai.
Conclusion
Data Analytics ke lie Excel me AI का use kaise kare, yah sikhne se professionals ke spreadsheets ke sath kaam krne ka tarika badal sakta hai.
Rows ko manually search karne, formulas likhne aur reports ko shuruaat se bananae me pura samay lagane ke bajaye,users AI-assisted features ki help se data explore kar sakte hai, calculations generate kar sakte hai, trends identify kar sakte hai, information summarize kar sakte hai aur useful visualizations bana sakte hai
sabse effective approach ye nahi hai ki AI ko human analysis ka replacement bana dia jae.
Iske bajae:
- Clean aur structured data se shuru kare.
- Specific questions puchhe.
- Results ko verify kare.
- Business context ke aadhar par numbers ka interpretation karein.
Jyada complex requirements ke lie Python in Excel jaise tools Excel ki analytical capabilities ko advanced data analysis aur visualization tak badha sakte hai.
Jaise-jaise businesses operational, customer, sales aur financial data ki badhti matra generate kar rahe hai, familiar spreadsheet tools ko AI-assisted analysis ke sath combine karna modern data workflow ka ek important hissa ban sakta hai.
Jab Excel akele sufficient nahi rehta, tab businesses custom software aur technology solutions par vichar kar sakte hai jo analytics aur automation ko unke broader operations ke sath integrate karein.
Hands-on example: use AI to check a sales total
Try this small illustrative dataset in Excel. It uses sample values only, so you can follow the steps without sharing real customer or business data.
| Date | City | Product | Sales (₹) |
|---|---|---|---|
| 1 Oct | Indore | Laptop | 45000 |
| 2 Oct | Dewas | Mouse | 800 |
| 3 Oct | Indore | Keyboard | 1500 |
| 4 Oct | Dewas | Laptop | 42000 |
| 5 Oct | Indore | Mouse | 1000 |
With City in column B and Sales in column D, ask your AI assistant: “Give me an Excel formula to total sales for Indore, where city is in B2:B6 and sales are in D2:D6. Explain each part.” A suitable formula is =SUMIF(B2:B6,"Indore",D2:D6). It returns ₹47,500 for this sample. Dewas totals ₹42,800, so Indore is higher in these five rows.
Check the cell ranges and result against the source rows before using the answer in a report. If you use an AI assistant outside Excel, avoid pasting personal, customer, or confidential business data; replace it with anonymised or sample values first.